TAZ Map
IMPORTANT! This tool is available only to KVH Airtime Service Providers.
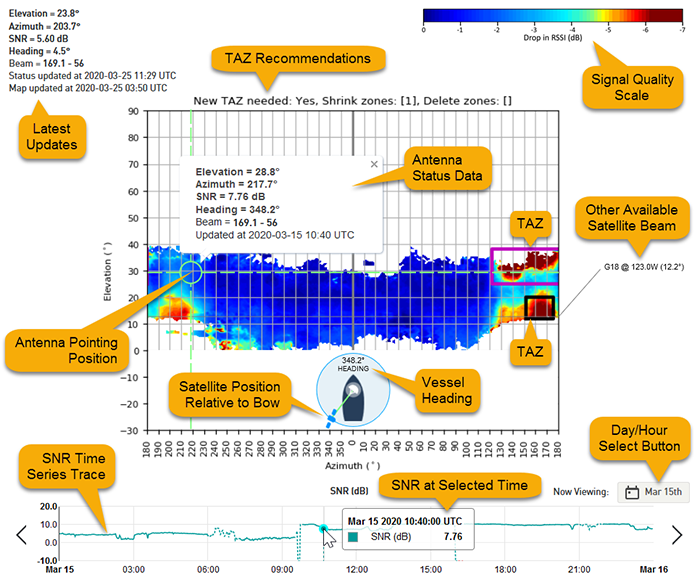
The TAZ Map shows the relative strength of the HTS satellite signal within the tracking range of the vessel's TracPhoneTracNet antenna, as well as the boundaries of any tracking avoidance zones (TAZ) that have been configured in the antenna. If a customer reports poor service connectivity, you might refer to this valuable resource to determine whether the satellite signal may have been partially blocked by an obstruction onboard the vessel, such as a mast, antenna, or other structure. (RF energy emitted by a radar or high-power radio can also degrade the signal.)
To access the TAZ Map, go to the TAZ Map page under SP Tools.

Signal Quality Map
This map is a graph that represents in two dimensions the entire three-dimensional space around the antenna in which it can potentially point to track an HTS service satellite in the sky. The antenna's 360º azimuth pointing range lies along the X-axis, while its elevation range lies within the Y-axis that spans -30º to 90º.
Plotted on the graph at each antenna pointing position (i.e., intersection of azimuth/elevation) is the relative quality of the satellite signal that the antenna has historically measured, on average, while tracking an HTS satellite in that direction (while online). Stronger signals with less dB loss are painted blue, while weaker signals appear yellow, orange, or red (select to view the color scale).
IMPORTANT! White areas indicate either a direction in which there is total blockage or simply a direction in which the antenna never actually needed to point to see the satellite. For example, if the vessel always operates within the same geographic region and doesn't travel far north or south, signal qualities will only be plotted within a narrow range of elevations on the graph. (Vessel latitude most determines antenna elevation.)
The map is refreshed daily (the date and time of the last update is available under ). Therefore, the map will become more refined over time as the antenna reports more and more data and tracks satellites in different directions while the vessel travels.
Tracking Avoidance Zones Overlay
Also plotted on the map are the boundaries of any tracking avoidance zones that have been configured in the antenna. These too are color-coded, based on KVH's analysis of the signal-quality data.
| TAZ Box Color | Meaning |
| Black | Zone is set up properly |
| Red | Zone should be deleted |
| Purple | Zone is too large; recommend shrinking its size |
Antenna Status Data
Green cross-hairs on the map indicate the direction in which the antenna is pointing. Click on its center circle to view the following information:
- Elevation to the satellite
- Azimuth to the satellite, relative to vessel forward (if antenna was installed properly with the "Forward" arrow pointing toward the bow)
- SNR – Signal-to-Noise Ratio, a measure of the satellite signal quality
- Vessel heading (available only if a NMEA input is connected to the BDU)
- Selected satellite beam (other satellite beams available from the vessel's location may be listed alongside the map at their respective elevations)
- Date and time (UTC) this data was reported
NOTE: There will be a lag of usually about 20-30 minutes between the time the data is recorded by the antenna and the time it will appear in the TAZ Map. (For each antenna, KVH collects a 10-minute batch of data from the antenna's diagnostics feed, processes it for display in the TAZ Map, uploads the data to the KVH Manager update queue, then repeats the cycle.)
Relative Satellite Position
The illustration at the bottom-center of the map indicates the location of the selected satellite relative to the vessel's heading, which is displayed above. If the satellite connection is poor, this indicator allows you to see at a glance where the antenna is pointing so you can consider any obstructions that may exist in that part of the vessel that could be blocking the signal.
IMPORTANT! The Relative Satellite Position indicator is only valid if both of the following conditions are true: (1) a NMEA heading input is connected to the antenna system's BDU, and (2) the antenna was installed properly with its "Forward" arrow pointing toward the bow, parallel with the vessel's centerline.
Historical Data
You can view the historical antenna data for any period within the last two weeks. In the upper-right corner of the time series graph at the bottom of the page, click the day/time select button. Then choose the desired hour, day, or week. The graph will plot the antenna's SNR data for that period. This time series trace may vary in appearance, as explained below.
| Trace Appearance | Meaning |
| Solid teal | Consistent satellite signal level – system online |
| Dashed teal | Inconsistent signal level – system may be online or offline |
| Dashed red, or gaps in the trace | No signal – system offline |
Click on any point in the time series trace to view the antenna status data in the Signal Quality Map for that particular point in time. Click and drag along the trace and the antenna status data dynamically updates in sync with the cursor on the trace.
NOTE: Antenna data cannot be displayed in the map for any periods when the system was offline. The antenna only records data while it is online.
Was this topic helpful? Please share your feedback.
© 2024-2025, KVH Industries, Inc., All rights reserved.
